
Comparing @Lactualite stock picks to index funds, 2015-2017
Intro
L’actualité, has recently published 2018 annual list of stocks recommended by experts. I usually welcome these lists with a sigh, but this time I thought I’d compare the past results of portfolios built using their past suggestions to the returns an investor would have received by following a “couch potato” investing.
The couch potato portfolio is built using 33% Canadian index stocks, 33% American stocks and 33% international stocks. The suggested portfolio is built using an equal weight of all suggested stocks.
The adjusted returns are evaluated between the date the article is released (in the first few weeks of a given year) and December 31st of the same year. Adjusted returns take split and dividends into account, which is the correct metric for evaluating portfolio returns. Most of my code is based on this vignette for package tidyquant.
This notebook will use the development version of package tidyquantto retrieve the data on yahoo and google services, the tidyverse packages for wrangling and plotting and the DTpackage for displaying tables.
Recommendations for 2017
These recommendations were published on ○January 19th, 2017.
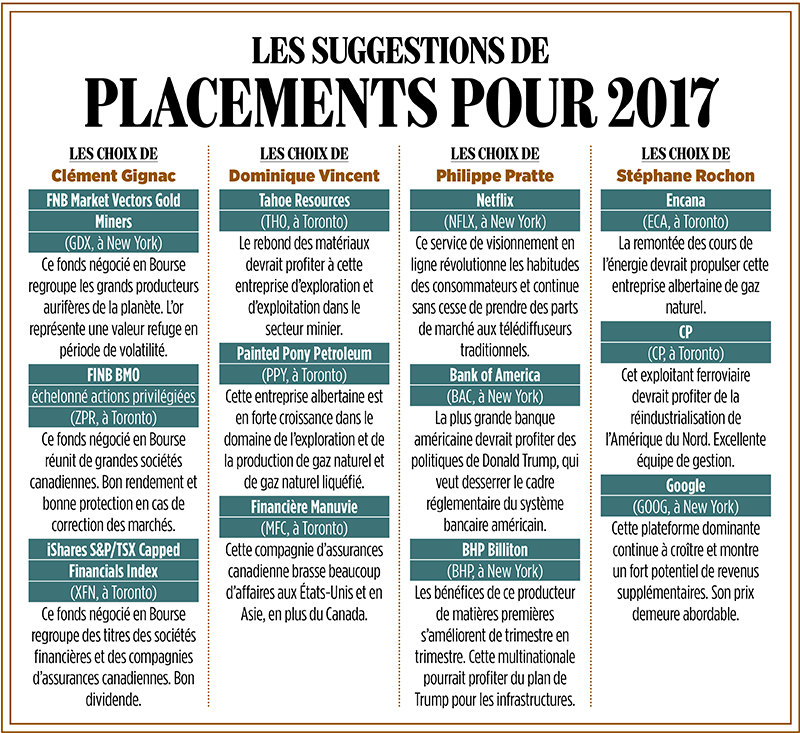
I believe that Painted Pony Petroleum Ltd (PPY.TO) changed ticker to PONY.TO because this page of the company refers to an acquisition that PPY.TO made, yet the stock quote at the top of the page refers to PONY.TO.
## [1] 0.1231049
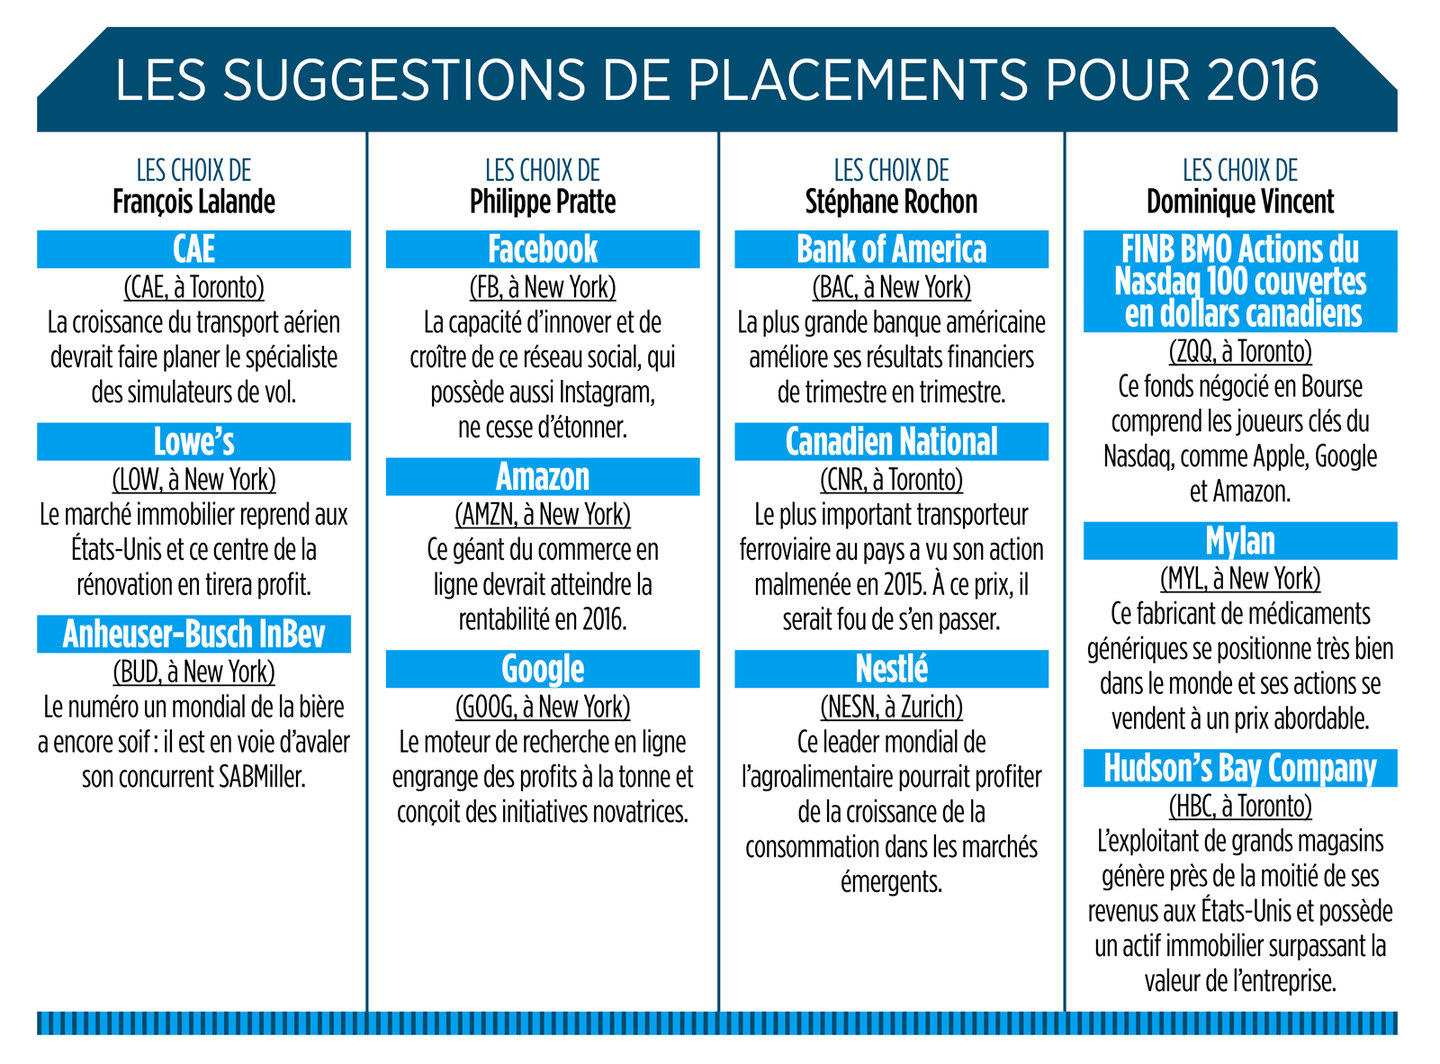
## [1] 0.1016732Recommendations for 2016
These recommendation were published on February 9th 2016
## [1] 0.2009278
## [1] 0.1936385
Recommendations for 2015
I couldnt recreate the returns for 2015 list because tidyquant couldnt provide the returns for CAM.TO and DH.TO using either Yahoo or Google APIs.
The yahoo function returned the following error :
While the google function returned this error:
Here are the recommendations, along with the average returns excluding these two companies.
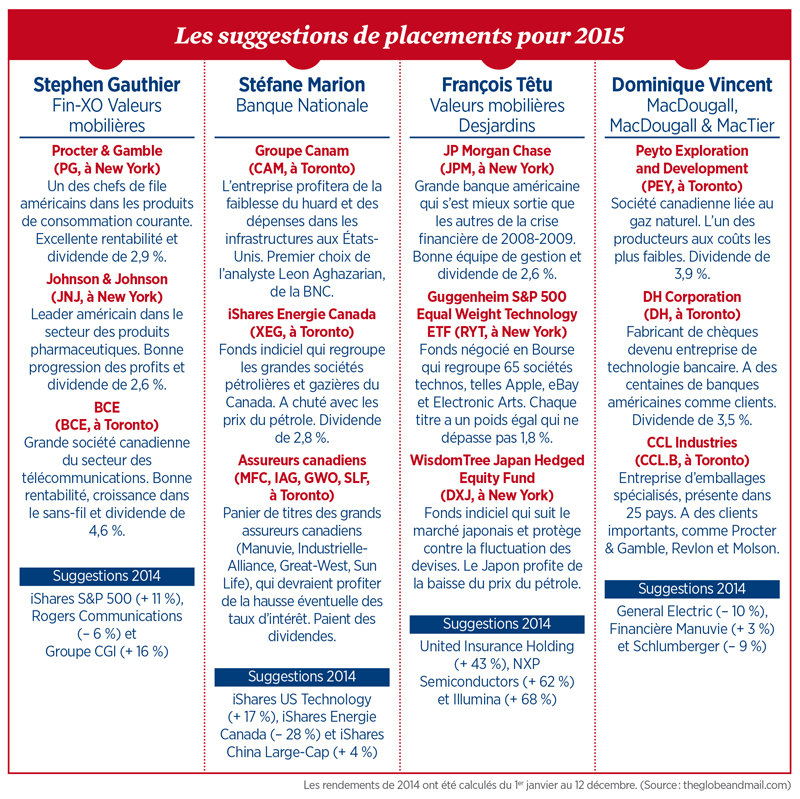
. They were released on January 16th, 2015.
## [1] 0.1199396
## [1] 0.0355869
Here is how I tried the stock.prices.google option when yahoo failed. It also failed. (edit 2020 : Error: Google Finance has been discontinued.)
Conclusion
The average beat the experts 2 years in 2016 and 2017. We don’t know for sure for 2015 since we are missing 2 stocks, but it was leading 12.0% to 11.1% at the time of printing..