
How far are cyclists willing to go to use a cycling path? A good excuse to try out Graphhopper
I made a twitter survey a couple of months before the apocalypse to help me pick my next blog post topic and all 3 members of the crowd overwhelmingly agreed that I should use bike gps data and graphhopper to find out how far cyclists are willing to go to use safer infrastructure.
This is awesome, because I had been looking for a use for this open data that contains GPS data for ~ 5000 bike trips in Montreal for a while.
I came up with the following methodology:
- Find out how many kilometers are spent on each road class for the shortest path possible between the origin and destination (eg: 10 kilometers on residential roads).
- Find out how many kilometers are actually spent on each road class (eg: 7 kilometers on residential roads, 6 kilometers on cycling pathways).
- The ratio between the kilometers increase in cycling pathway and the kilometer decrease in less-safe roads defines how much cycling pathways are preferred over less-safe roads.
In my example, the ratio is 2.0, as the cyclists are willing to do 6 kilometers on cycling pathways to reduce their residential road milage by 3.
This turned out to be quite an undertaking. I have hit many snags, and I don’t have an answer yet. I dont think I ever will, but hopefully putting this in the open will help someone get started with graphhopper.
The interested reader might also want to look at this deck by Licker Geospatial Consulting Co. (@LGeospatial on twitter).
Code
As usual, the code for this post is available on github.
Data
Bike trip data
We use open data recorded by the “Mon RésoVélo” app of the city of Montréal. The JSON file includes around 5000 trips (4881 to be precise).
It includes a linestring geometry depicting the path travelled,a column named “liste_segments_jsonb” giving the IDs of the segments travelled (looks like the city did some mapmatching too) and the columns shown below:
## Rows: 5
## Columns: 9
## $ stop                 <dttm> 2013-06-25 17:34:16, 2013-07-25 15:40:06, 2013-…
## $ id_origine           <int> 52, 2325, 2326, 53, 56
## $ start                <dttm> 2013-06-25 17:21:21, 2013-07-25 15:37:42, 2013-…
## $ length               <int> 3163, 1066, 5619, 3115, 5376
## $ purpose              <chr> "Commute", "Courses", "Courses", "Commute", "Dom…
## $ n_coord              <int> 511, 196, 1036, 1403, 1004
## $ id                   <int> 52, 2325, 2326, 53, 56
## $ liste_segments_jsonb <list> [<"{ \"source\": \"GEOBASE\", \"id\": 1260962 }…
## $ geometry             <LINESTRING [°]> LINESTRING (-73.57748 45.50..., LINES…
The map below shows the routes 56 and 10044 that we will often use as examples in this blog post.

Since the map matching tool requires GPX files as input, we convert the linestring to multipoint, then export each trip to a gpx file name id_NNN.gps using the pgirmess::writeGPX function.
OpenStreetMap data (road layout)
We download the latest openstreetmap data for the province of Quebec from GeoFabrik.
A special tool : Graphhopper
Graphhopper (github is an “open source routing engine”. It includes many tools/servers, and we will use the following two for this project:
- The map matching program that takes a GPS path and returns a list of points “snapped” to the road. It is available as a command-line tool or as a web server that can be called using an API. We will use the web server because the command-line tool doesnt return the distance travelled by road class.
- The routing engine returns the shortest path (with instruction) between two points. It is only available as a web server that can be called using an API.
Map matching tool installation and use
We will follow the installation instructions on the git repository, with a few changes:
- We download the “recent_core” branch instead of master because it is required for the “vehicle=bike” option to work,
- We import the road network for the province of Quebec instead of the city of Berlin.
Note: Java 8 and Maven >=3.3 are required.
cd ~
mkdir git
cd git
git clone https://github.com/graphhopper/map-matching.git --branch 'recent_core'
cd map-matching
mvn package -DskipTests
wget http://download.geofabrik.de/north-america/canada/quebec-latest.osm.pbf --quiet
java -jar matching-web/target/graphhopper-map-matching-web-1.0-SNAPSHOT.jar import quebec-latest.osm.pbf --vehicle='bike'
Once the quebec map has been imported into the mapmatching tool, we can invoke it from the command line and ask it to map-match all the we put GPXs in the folder. This takes about 10 minutes on my computer. <– While this is true (and the code below works), the CLI tool doesnt return the road class travelled. We will use the web app instead.
cd ~/git/map-matching
java -jar ~/git/map-matching/matching-web/target/graphhopper-map-matching-web-1.0-SNAPSHOT.jar match ~/git/snippets/content/post/data/interim/bikegps/*.gpx
The resulting file is a bunch of files named id_NNN.gpx.res.gpx and the here is a comparison of the original trip with the map-matched trip.
We matched 4858 / 4881 (99.5%) of the trips. When this happened, we got an error that looked like this :
Problem with file /home/simon/git/snippets/content/post/data/interim/bikegps/id_1035.gpx java.lang.IllegalArgumentException: Sequence is broken for submitted track at time step 136 (2387 points). Too long distance to previous measurement? 6182m, observation:Observation{point=45.4757,-73.49115,0.0}, 6 candidates: [distance: 1.2748924992141155 to 45.4756918283334,-73.49116146917257,NaN, distance: 18.8576048599668 to 45.47556516846043,-73.49129669721343,NaN, distance: 1.179455381764211 to 45.47569018147931,-73.49115572348161,NaN, distance: 1.179455381764211 to 45.47569018147931,-73.49115572348161,NaN, distance: 1.143030762846551 to 45.475696624844865,-73.49116384693039,NaN, distance: 1.143030762846551 to 45.475696624844865,-73.49116384693039,NaN]. If a match is expected consider increasing max_visited_nodes. at com.graphhopper.matching.MapMatching.computeViterbiSequence(MapMatching.java:386) at com.graphhopper.matching.MapMatching.doWork(MapMatching.java:184) at com.graphhopper.matching.cli.MatchCommand.run(MatchCommand.java:102) at io.dropwizard.cli.Cli.run(Cli.java:78) at io.dropwizard.Application.run(Application.java:93) at com.graphhopper.matching.http.MapMatchingApplication.main(MapMatchingApplication.java:16)
Let’s import these matched trips GPX back into R, and see how the map-matching did with our trip #10044
Its working fine! As you can see, the 10044_matched trip is matched to the cycling lane on Rachel instead of the road. This means the map matching algorithm really is using the “bike” vehicle option.
Routing tool installation
Alright, now let’s try to find what was the shortest route between the first and the last point.
The routing engine is not a command line tool like the map-matching tool, but a web server that can be called using an API.
I describe 3 ways to get it running below. The easiest by far is you already have a docker hub account is to pull my image: morglum/graphhopper_quebec .
The graphhopper routing engine is located at https://github.com/graphhopper/graphhopper
We install it following the quickstart guide for developpers, because the quickstart guide using a *.jar file (https://github.com/graphhopper/graphhopper/blob/0.13/docs/web/quickstart.md) returns an error when using the bike vehicle.
We replaced the including “config-example.yml” with my own config-bike.yml, shared as a gist. The differences are as follow:
- replace
graph.flag_encoders: carwithgraph.flag_encoders: bike, car,
- add
- name: bike vehicle: bike weighting: fastestunderprofiles: - name: car vehicle: car weighting: fastest
- add
- profile: bikeunder
profiles_ch: - profile: car
NOTE/QUESTION : I wasted a lot of time trying to get it with bike as the only available vehicle, to no avail. It appears you can only add vehicles to “car”, not replace car with another vehicle.
Installation (non-docker)
cd ~/git/
git clone git://github.com/graphhopper/graphhopper.git
cd graphhopper
cd web/src/main/resources/ && ZFILE=/tmp/gh.jar && wget -O $ZFILE 'https://repository.sonatype.org/service/local/artifact/maven/redirect?r=central-proxy&g=com.graphhopper&a=graphhopper-web&v=LATEST' && unzip $ZFILE assets/js/main.js && rm $ZFILE && cd ../../../..
rm config-example.yml
wget https://gist.githubusercontent.com/SimonCoulombe/c4e4bb3af45ba6b4ccdd48aab561b2dc/raw/config-bike.yml
wget http://download.geofabrik.de/north-america/canada/quebec-latest.osm.pbf --quiet
./graphhopper.sh -a web -i quebec-latest.osm.pbf  -c config-bike.yml
Installation (create your own docker image)
This takes a while because it needs to download osm data for quebec and build a cache for the network.
cd ~/git/
git clone git://github.com/graphhopper/graphhopper.git
cd graphhopper
rm config-example.yml
wget https://gist.githubusercontent.com/SimonCoulombe/c4e4bb3af45ba6b4ccdd48aab561b2dc/raw/config-bike.yml
mv config-bike.yml config-example.yml
rm Dockerfile
wget https://gist.githubusercontent.com/SimonCoulombe/ac4acfffdc5a4ac9a1a262703bfc5911/raw/Dockerfile # mon dockerfile utilise mon config et le québec
docker build -t morglum/graphhopper_quebec .
cd ~
mkdir docker_volumes
cd docker_volumes
mkdir graphhopper
docker run -d --name graphhopper -v ~/docker_volumes/graphhopper/data:/data -p 8989:8989 --restart unless-stopped graphhopper_quebec
Installation (pull my docker image)
docker pull morglum/graphhopper_quebec
mkdir -p ~/docker_volumes/graphhopper/data
docker run -d --name graphhopper -v ~/docker_volumes/graphhopper/data:/data -p 8989:8989 --restart unless-stopped morglum/graphhopper_quebec
Once running, visit http://127.0.0.1:8989
Routing tool API usage
The documentation for the routing engine web api is found at https://github.com/graphhopper/graphhopper/blob/0.13/docs/web/api-doc.md .
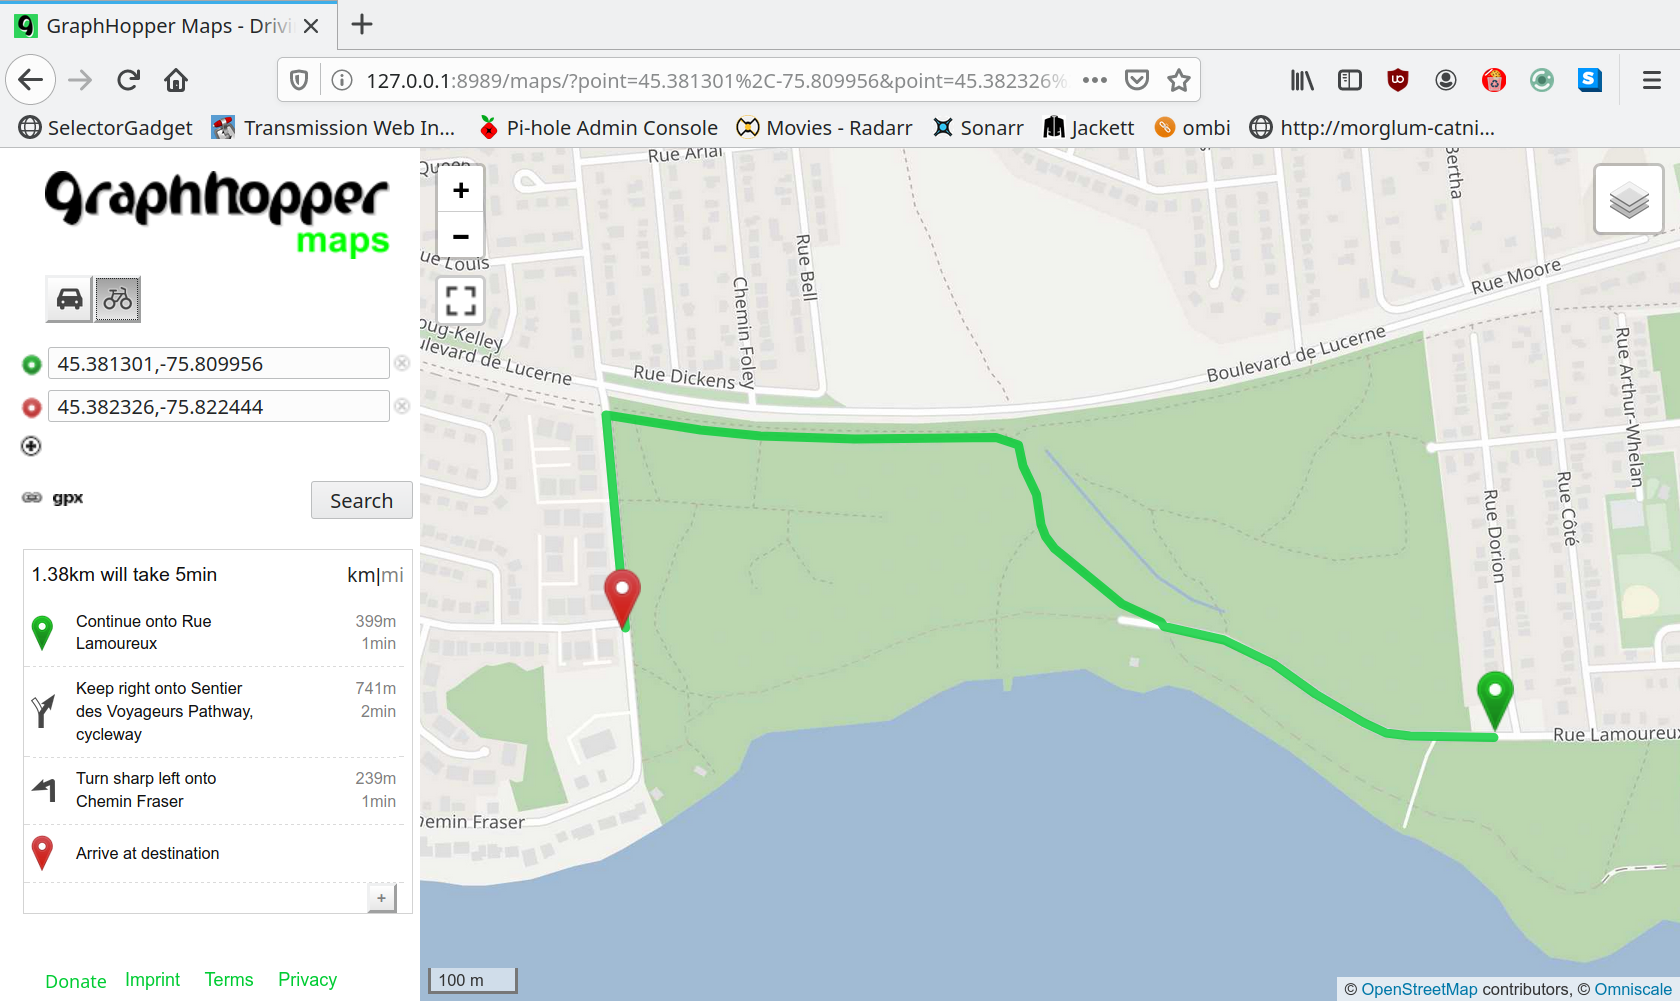
Here is the JSON returned for a short route between two points near park in gatineau.
api_results <- fromJSON("http://localhost:8989/route?point=45.381271%2C-75.809054&point=45.380759%2C-75.82253&vehicle=bike&details=road_class&points_encoded=false")
api_results %>% str
## List of 3
## $ hints:List of 2
## ..$ visited_nodes.average: num 32
## ..$ visited_nodes.sum : int 32
## $ info :List of 2
## ..$ copyrights: chr [1:2] "GraphHopper" "OpenStreetMap contributors"
## ..$ took : int 165
## $ paths:'data.frame': 1 obs. of 13 variables:
## ..$ distance : num 1642
## ..$ weight : num 247
## ..$ time : int 328378
## ..$ transfers : int 0
## ..$ points_encoded : logi FALSE
## ..$ bbox :List of 1
## .. ..$ : num [1:4] -75.8 45.4 -75.8 45.4
## ..$ points :'data.frame': 1 obs. of 2 variables:
## .. ..$ type : chr "LineString"
## .. ..$ coordinates:List of 1
## .. .. ..$ : num [1:31, 1:2] -75.8 -75.8 -75.8 -75.8 -75.8 ...
## ..$ instructions :List of 1
## .. ..$ :'data.frame': 4 obs. of 10 variables:
## .. .. ..$ distance : num [1:4] 469 741 431 0
## .. .. ..$ heading : num [1:4] 269 NA NA NA
## .. .. ..$ sign : int [1:4] 0 7 -3 4
## .. .. ..$ interval :List of 4
## .. .. .. ..$ : int [1:2] 0 7
## .. .. .. ..$ : int [1:2] 7 25
## .. .. .. ..$ : int [1:2] 25 30
## .. .. .. ..$ : int [1:2] 30 30
## .. .. ..$ text : chr [1:4] "Continue onto Rue Lamoureux" "Keep right onto Sentier des Voyageurs Pathway" "Turn sharp left onto Chemin Fraser" "Arrive at destination"
## .. .. ..$ time : int [1:4] 93885 148205 86288 0
## .. .. ..$ street_name : chr [1:4] "Rue Lamoureux" "Sentier des Voyageurs Pathway" "Chemin Fraser" ""
## .. .. ..$ annotation_text : chr [1:4] NA "cycleway" NA NA
## .. .. ..$ annotation_importance: int [1:4] NA 0 NA NA
## .. .. ..$ last_heading : num [1:4] NA NA NA 241
## ..$ legs :List of 1
## .. ..$ : list()
## ..$ details :'data.frame': 1 obs. of 1 variable:
## .. ..$ road_class:List of 1
## .. .. ..$ : chr [1:3, 1:3] "0" "7" "25" "7" ...
## ..$ ascend : num 0
## ..$ descend : num 0
## ..$ snapped_waypoints:'data.frame': 1 obs. of 2 variables:
## .. ..$ type : chr "LineString"
## .. ..$ coordinates:List of 1
## .. .. ..$ : num [1:2, 1:2] -75.8 -75.8 45.4 45.4I find the following useful for my use case:
1 ) The “coordinates” columns gives us all the points in the path. There are 31 points.
api_results$paths$points$coordinates[[1]]## [,1] [,2]
## [1,] -75.80905 45.38124
## [2,] -75.81116 45.38124
## [3,] -75.81150 45.38128
## [4,] -75.81183 45.38137
## [5,] -75.81250 45.38166
## [6,] -75.81310 45.38196
## [7,] -75.81381 45.38222
## [8,] -75.81467 45.38235
## [9,] -75.81471 45.38238
## [10,] -75.81480 45.38242
## [11,] -75.81509 45.38249
## [12,] -75.81528 45.38257
## [13,] -75.81624 45.38313
## [14,] -75.81637 45.38324
## [15,] -75.81644 45.38336
## [16,] -75.81646 45.38359
## [17,] -75.81649 45.38367
## [18,] -75.81668 45.38397
## [19,] -75.81674 45.38417
## [20,] -75.81690 45.38422
## [21,] -75.81709 45.38425
## [22,] -75.81836 45.38422
## [23,] -75.81909 45.38422
## [24,] -75.82044 45.38426
## [25,] -75.82131 45.38432
## [26,] -75.82266 45.38447
## [27,] -75.82220 45.38099
## [28,] -75.82221 45.38088
## [29,] -75.82225 45.38080
## [30,] -75.82235 45.38074
## [31,] -75.82248 45.38069- “Instructions” contains the text instruction your GPS would normally give you, but also a “distance” travelled column (in meters) and an “interval” column telling us which points fit with which instructions.
api_results$path$instructions[[1]]## distance heading sign interval text
## 1 469.434 269.1 0 0, 7 Continue onto Rue Lamoureux
## 2 741.037 NA 7 7, 25 Keep right onto Sentier des Voyageurs Pathway
## 3 431.449 NA -3 25, 30 Turn sharp left onto Chemin Fraser
## 4 0.000 NA 4 30, 30 Arrive at destination
## time street_name annotation_text annotation_importance
## 1 93885 Rue Lamoureux <NA> NA
## 2 148205 Sentier des Voyageurs Pathway cycleway 0
## 3 86288 Chemin Fraser <NA> NA
## 4 0 <NA> NA
## last_heading
## 1 NA
## 2 NA
## 3 NA
## 4 241.4043In our example, the interval column indicates that the first instruction (continue onto Rue Lamoureux) is illustrated by the points 0 to 7, the second instruction (Keep right onto Sentier des Voyageurs Pathway) is illustrated by point 7-25 … etc..
api_results$path$instructions[[1]]$interval## [[1]]
## [1] 0 7
##
## [[2]]
## [1] 7 25
##
## [[3]]
## [1] 25 30
##
## [[4]]
## [1] 30 30Finally, the “road class” column tells us that the points 0 to 7 are on a “residential” road, while points 7 to 25 are on a “cycleway”.
##      [,1] [,2] [,3]
## [1,] "0"  "7"  "residential"
## [2,] "7"  "25" "cycleway"
## [3,] "25" "30" "residential"
Let’s get some work done!
API functions
First, I create some function to call the API from R and wrangle the output :
generate_api_call <- function(geometry, origin_destination_only = FALSE){

  if(origin_destination_only == FALSE){
    paste0(
      "http://localhost:8989/route?",
      st_coordinates(geometry) %>%
        as_tibble() %>%
        mutate(rownum = row_number(),
               random = runif(nrow(.)),
               rank = rank(random)) %>%
        filter(rownum == 1 | rownum == nrow(.) | rank < 250) %>%
        mutate(
          texte = paste0(
            "point=", Y, "%2C", X)
        )  %>% pull(texte) %>% paste(., collapse="&"),
      "&vehicle=bike&details=road_class&points_encoded=false"
    )
  } else if(origin_destination_only == TRUE){
    paste0(
      "http://localhost:8989/route?",
      st_coordinates(geometry) %>%
        as_tibble() %>%
        slice(1, n()) %>% # keep first and last coordinates
        mutate(rownum = row_number(),
               random = runif(nrow(.)),
               rank = rank(random)) %>%
        filter(rownum == 1 | rownum == nrow(.) | rank < 250) %>%
        mutate(
          texte = paste0(
            "point=", Y, "%2C", X)
        )  %>% pull(texte) %>% paste(., collapse="&"),
      "&vehicle=bike&details=road_class&points_encoded=false"
    )

  }
}

get_api_results <- function(geometry, origin_destination_only = FALSE){
  fromJSON(
    url(
      generate_api_call(geometry = geometry,
                        origin_destination_only = origin_destination_only)
    )
  )
}

get_routed_linestring <- function(api_results){
  api_results$paths$points$coordinates[[1]] %>%
    as_tibble() %>%
    rename(lon = V1, lat= V2) %>%
    st_as_sf(coords = c("lon", "lat"), crs = 4326) %>%
    summarize(., do_union = FALSE) %>%
    st_cast("LINESTRING")
}

get_distances_from_api_results <- function(api_results){
  tibble(
    distance = api_results$paths$instructions[[1]] %>% pull(distance),
    point_from = map(api_results$paths$instructions[[1]]$interval, ~ .x[1]) %>% unlist(),
    point_to   = map(api_results$paths$instructions[[1]]$interval, ~ .x[2]) %>% unlist(),
  )
}

get_road_classes_from_api_results <- function(api_results){
  tibble(
    from       = api_results$paths$details$road_class[[1]][,1], # from point
    to         = api_results$paths$details$road_class[[1]][,2], # to point
    road_class = api_results$paths$details$road_class[[1]][,3]  # type de route
  )
}

get_each_point_road_class_from_road_classes <- function(road_classes){
  road_classes %>%
    mutate(data = map2(as.numeric(from), as.numeric(to), ~ {
      data_frame(
        point_from =
          seq(
            from= .x,
            to = .y-1 ,
            by = 1
          ))
    })) %>% unnest(data) %>%
    select(-from, -to)
}
Find the shortest paths between origin and destination (and the distance travelled by road class.)
The code chunk below returns a table with a linestring showing the shortest route, a distance_by_road_class list_column with tibbles showing the distance in each road class for the tripp
TODO :. what about loops where origin = destination? length = 0… let’s ditch them. but all loops should be dropped as people obviously didnt take the shortest path..
This is the content of “shortest route” for id 10044
## Rows: 1
## Columns: 8
## $ group                  <chr> "10044"
## $ api_results            <list> [[[62, 62], [<"GraphHopper", "OpenStreetMap c…
## $ length_routed          <dbl> 1230.7
## $ geometry               <LINESTRING [°]> LINESTRING (-73.57079 45.53...
## $ distances              <list> [<tbl_df[5 x 3]>]
## $ road_classes           <list> [<tbl_df[4 x 3]>]
## $ road_classes_points    <list> [<tbl_df[6 x 2]>]
## $ distance_by_road_class <list> [<tbl_df[3 x 2]>]
This is the content of “shortest route”’s “distance_by_road_class” for id 10044
## [[1]]
## # A tibble: 3 x 2
##   road_class  distance
##   <chr>          <dbl>
## 1 cycleway       261.
## 2 residential    913.
## 3 secondary       55.4
Let’s map the actual gps data, the map matched route and the shortest route together for id 56
.. but we also need the actual distance travelled by road class !
Here’s something that kinda sucks : the map matching program returns a bunch of points, but it doesnt tell us the road class that was actually travelled.
Here is what we are going to do. We are going to take as many points as possible from the map-matched route and feed it to the routing API. This will give us a distance travelled by road class and hopefully it wont be too borked.
Some issues I got :
- the fromJSON function falsely interprets long URLs as actual text return by an API. To prevent this from happening, we can use the url() function inside the fromJSON function like this: fromJSON(url(filesURL)) . This idea was found [h]ere on github](https://github.com/jeroen/jsonlite/issues/230).
- Firefox crashes when I give it URLs that are too long (error: URI too long), such as for id = 1015 which has around 400 matched points. The cutoff appears to be somewhere around 275 points. My fix is to keep a maximum of 250 random points (including origin and destination).
It … kinda works… but there are some random hiccups. Look at our old friend 56 below
To compensate for these extra meters, we will apply the ratio between length(matched) and length(routed_matched) to the distance travelled in each road class.
So .. the results !
Yeah.. there is some thinking to do here. The travelled distance is much longer than the shortest possible distance because a lot of the trips are “loops”. This means that the travelled distance is longer than the shortest distance for all road classes and that we can’t calculate a trade-off
Ah well, at least I learned to use graphhopper and got to publish my first docker image along the way.
NOTE/QUESTION: I didnt find a way to return the “edge id” of the path returned by graphhopper. I think it would be interesting to find which dangerous roads are most often ignored even though they offer a short path.
| road_class | shortest_distance | travelled_distance | diff |
|---|---|---|---|
| residential | 7730760 | 9397188 | 1666427 |
| cycleway | 6311952 | 6636475 | 324524 |
| secondary | 2357788 | 5652878 | 3295089 |
| tertiary | 4187499 | 5263252 | 1075753 |
| primary | 188080 | 966677 | 778597 |
| footway | 152416 | 954382 | 801965 |
| service | 156998 | 833343 | 676345 |
| pedestrian | 39472 | 340562 | 301090 |
| unclassified | 86905 | 323427 | 236522 |
| path | 9843 | 56300 | 46458 |
| trunk | 669 | 34166 | 33497 |
| steps | 1169 | 10055 | 8887 |
| living_street | 85 | 1744 | 1658 |
| other | 29 | 522 | 493 |