I’ve stumbled on something.. interesting.
To get the prediction for a Tweedie GLM, we take the link value then do exp(link), but to get prediction from an xgboost tweedie , we take the “link” value then do exp(link)/ 2 , dividing the result by 2.
Is this normal? Below is a quick demo showing how I get the predictions for a 3-trees xgboost and a glm.
the code has been modified from the tweedie regression demo in the xgboost repository: https://github.
blo
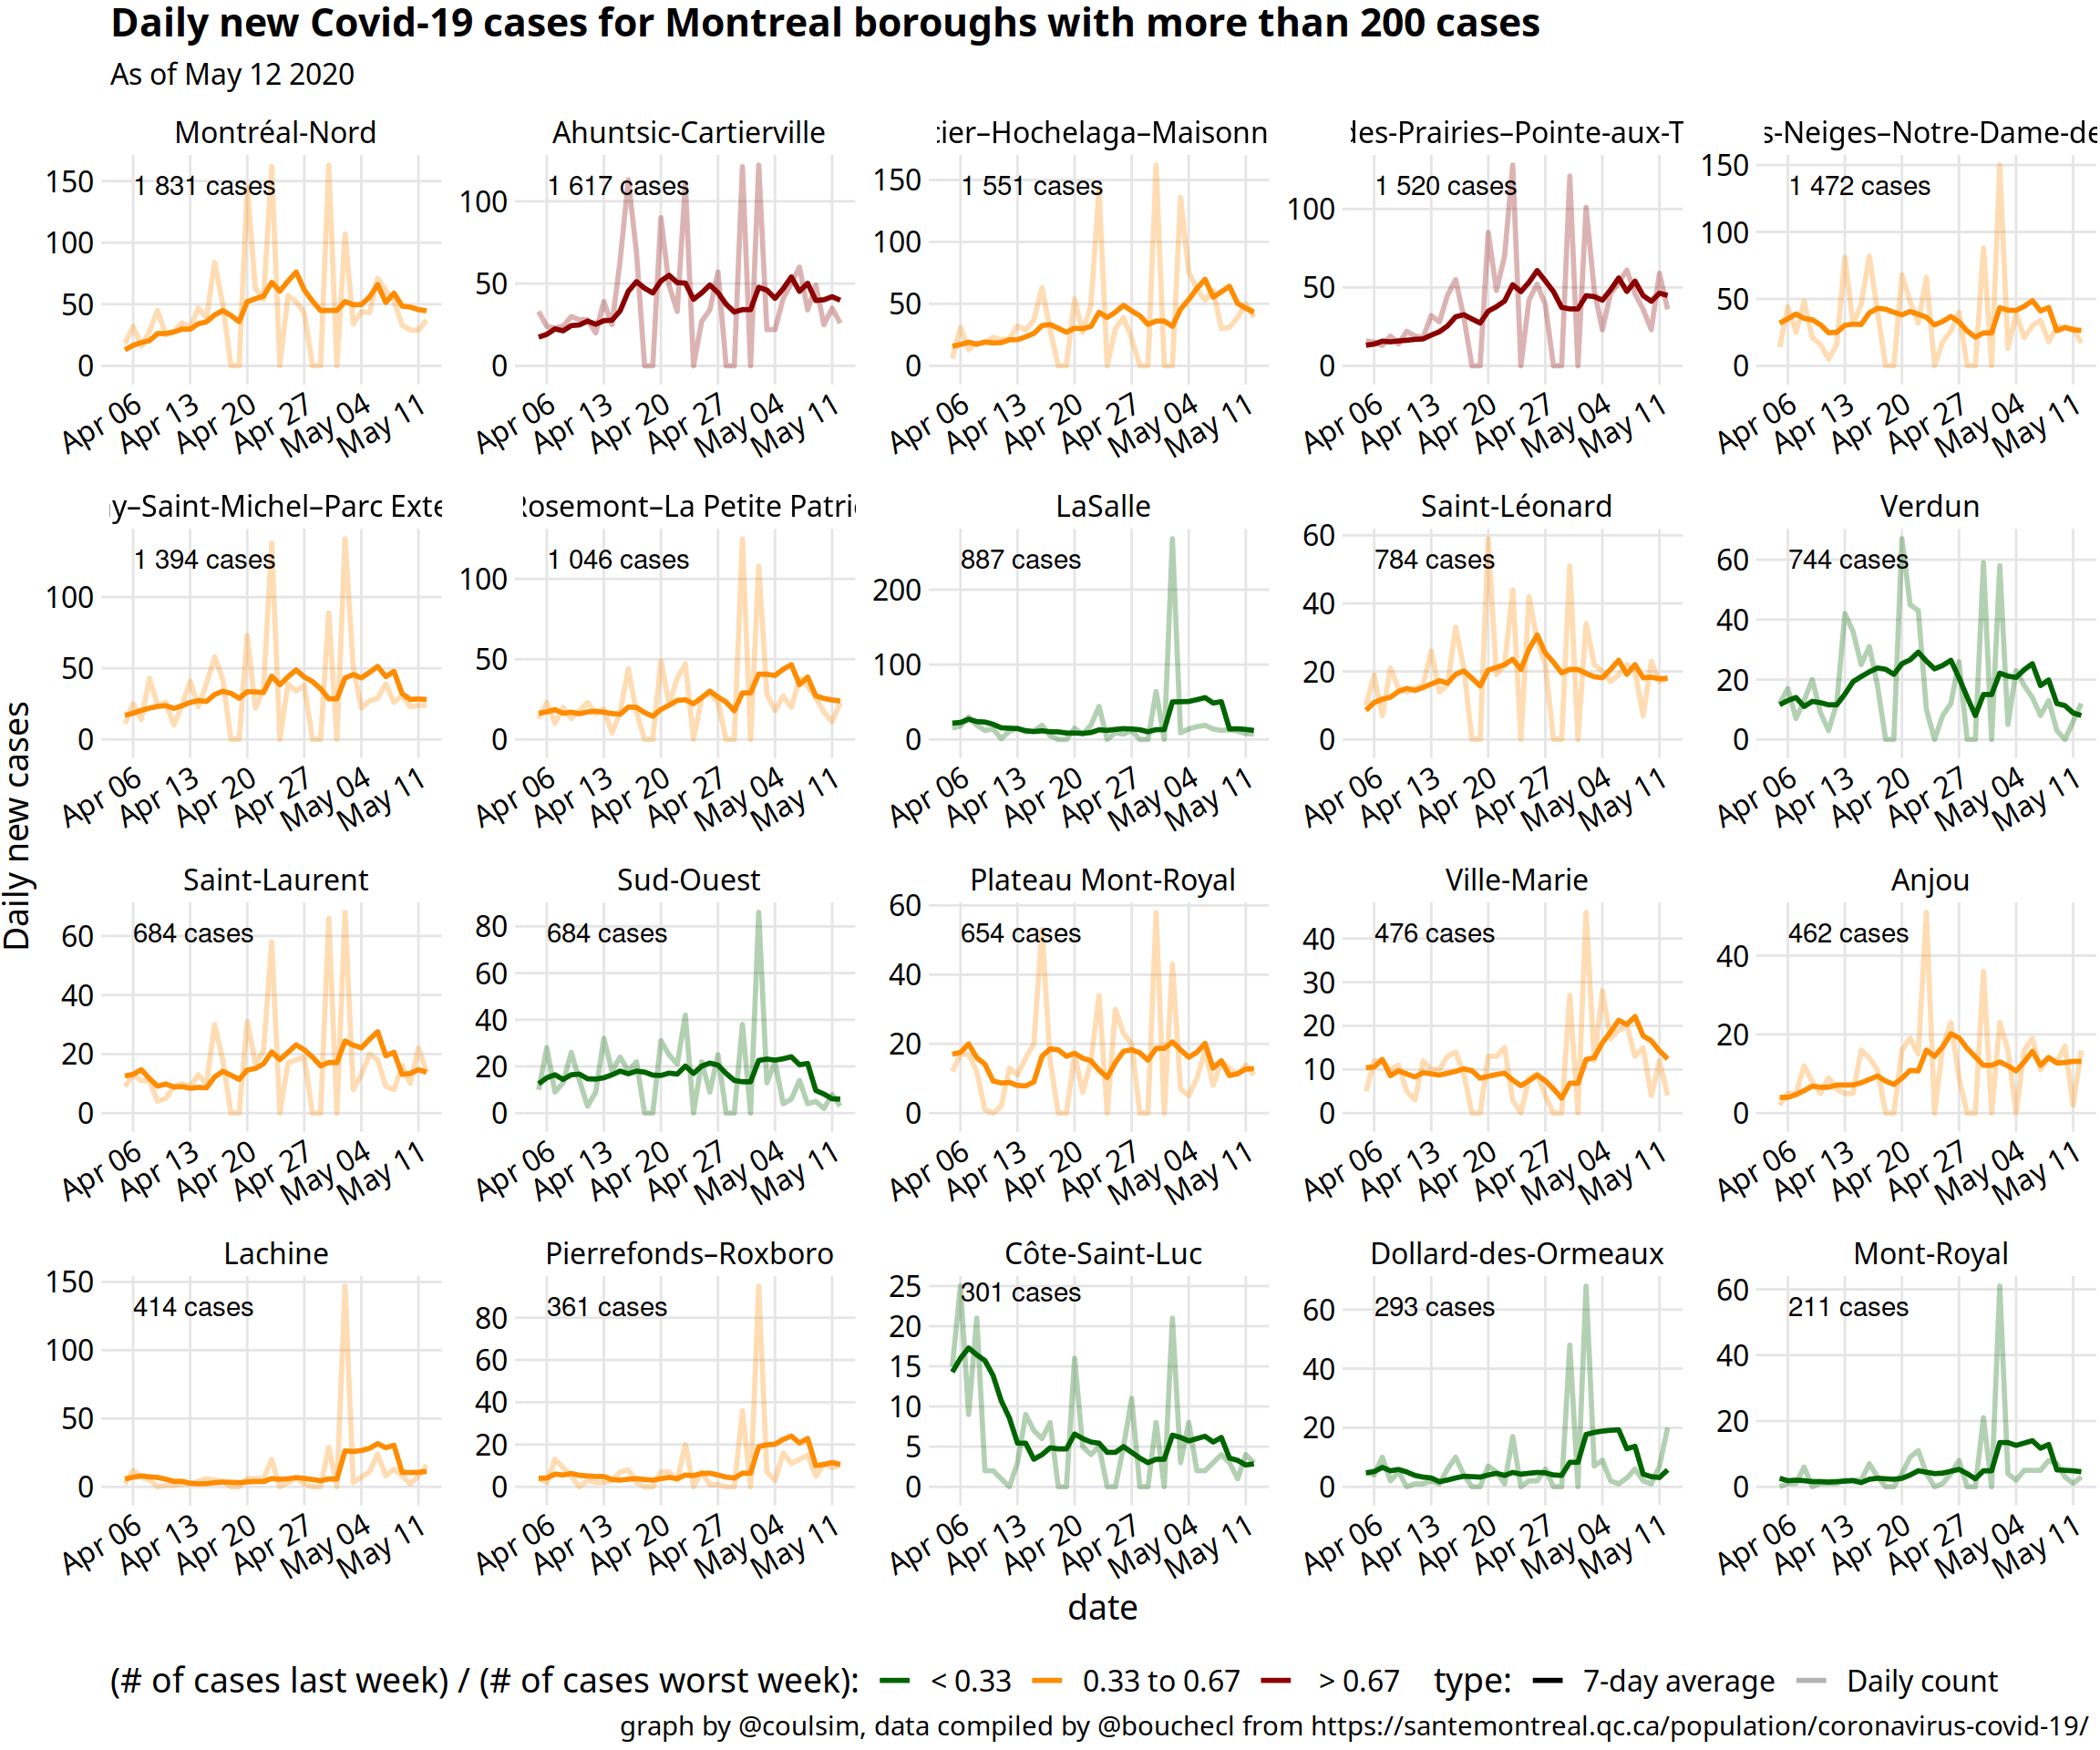
Quick post inspired by the winning / nearly there / need action graphs by @yaneerbaryam at https://www.endcoronavirus.org/countries.
Data Health regions date is compiled by Isha Berry & friends github. Montreal boroughs data is published daily. They only keep the total and keep no history, so @bouchecl visits them every day and compiles the data in this google sheet
Code I went a bit over the top for this one and created an R package you can install to recreate all the graphs and fetch the data.
I made a twitter survey a couple of months before the apocalypse to help me pick my next blog post topic and all 3 members of the crowd overwhelmingly agreed that I should use bike gps data and graphhopper to find out how far cyclists are willing to go to use safer infrastructure.
This is awesome, because I had been looking for a use for this open data that contains GPS data for ~ 5000 bike trips in Montreal for a while.
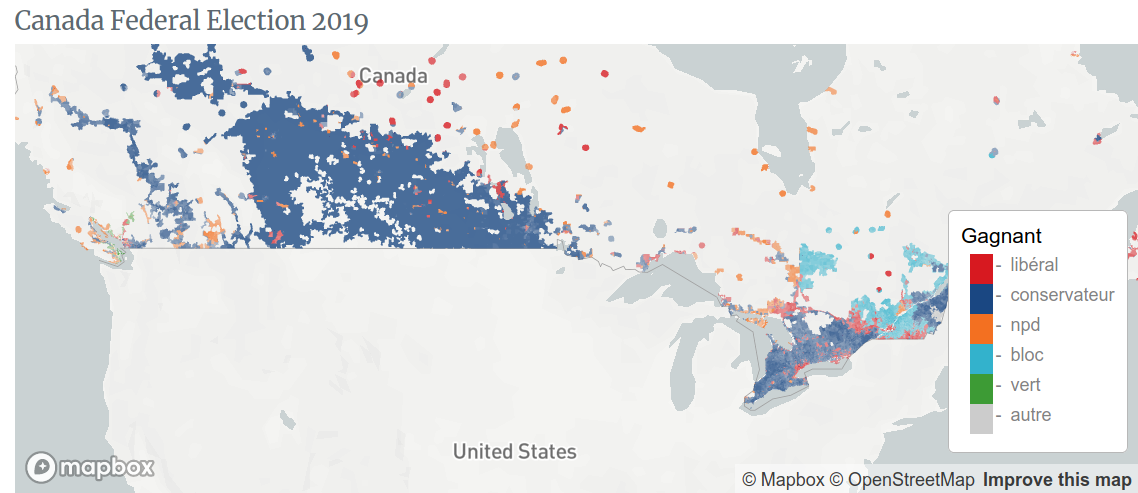
Canada Federal Election 2019
I just got my feet wet with tweedie regression and the recipes package yesterday. The results have been underwhelming, as the models didnt appear that predictive. I figured I might give it another try, this time using Kaggle’s claim prediction challenge from 2012.
It is no longer possible to submit models, so we will create our own 20% test sample from the kaggle training data set and see how we fare.
I’m building my first tweedie model, and I’m finally trying the {recipes} package.
We will try to predict the pure premium of car insurance policy. This can be done directly with a tweedie model, or by multiplying two separates models: a frequency (Poisson) and a severity (Gamma) model. We wil be using “lift charts” and “double lift charts” to evaluate the model performance .
Here’s is the plan:
Pre-process the train and test data using recipes.
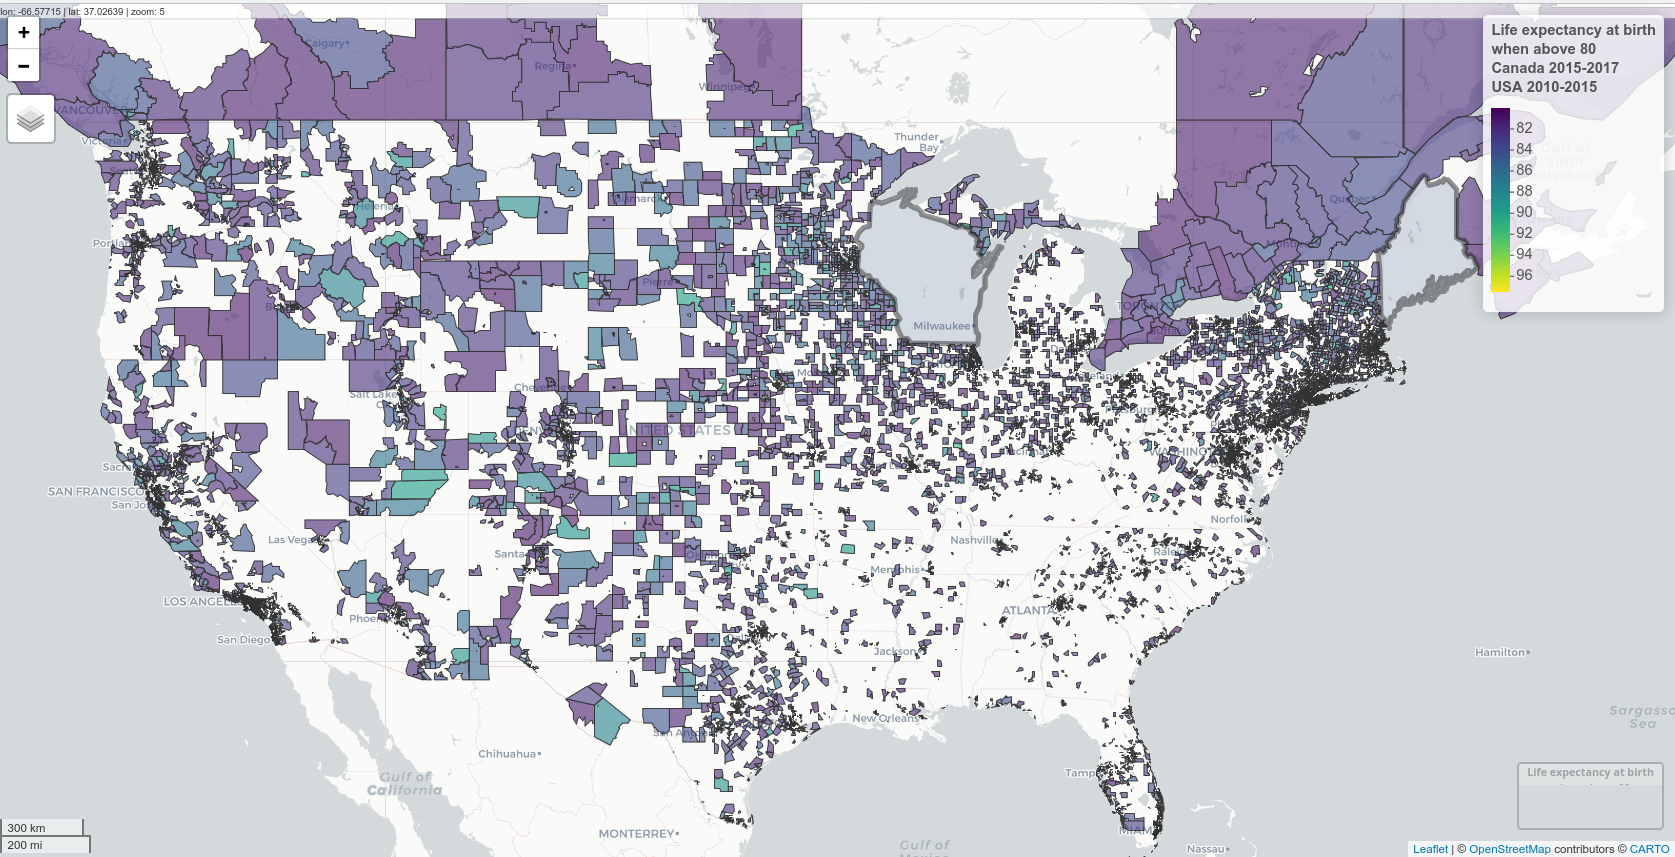
I found life expectancy at birth data for “health regions” in Canada for 2015-2017 and in “census tracts” in the USA for 2010-2015.
Here is a map of these two countries, excluding areas with a life expectancy at birth lower than 0.
Data sources and shapefiles: Canada mortality. Canada shapefiles. USA mortality. USA shapefiles downloaded using the tigris package. Libraries The usual data wrangling libraries for spatial data (tidyverse, sf), mapped using mapview and leaflet.