blo
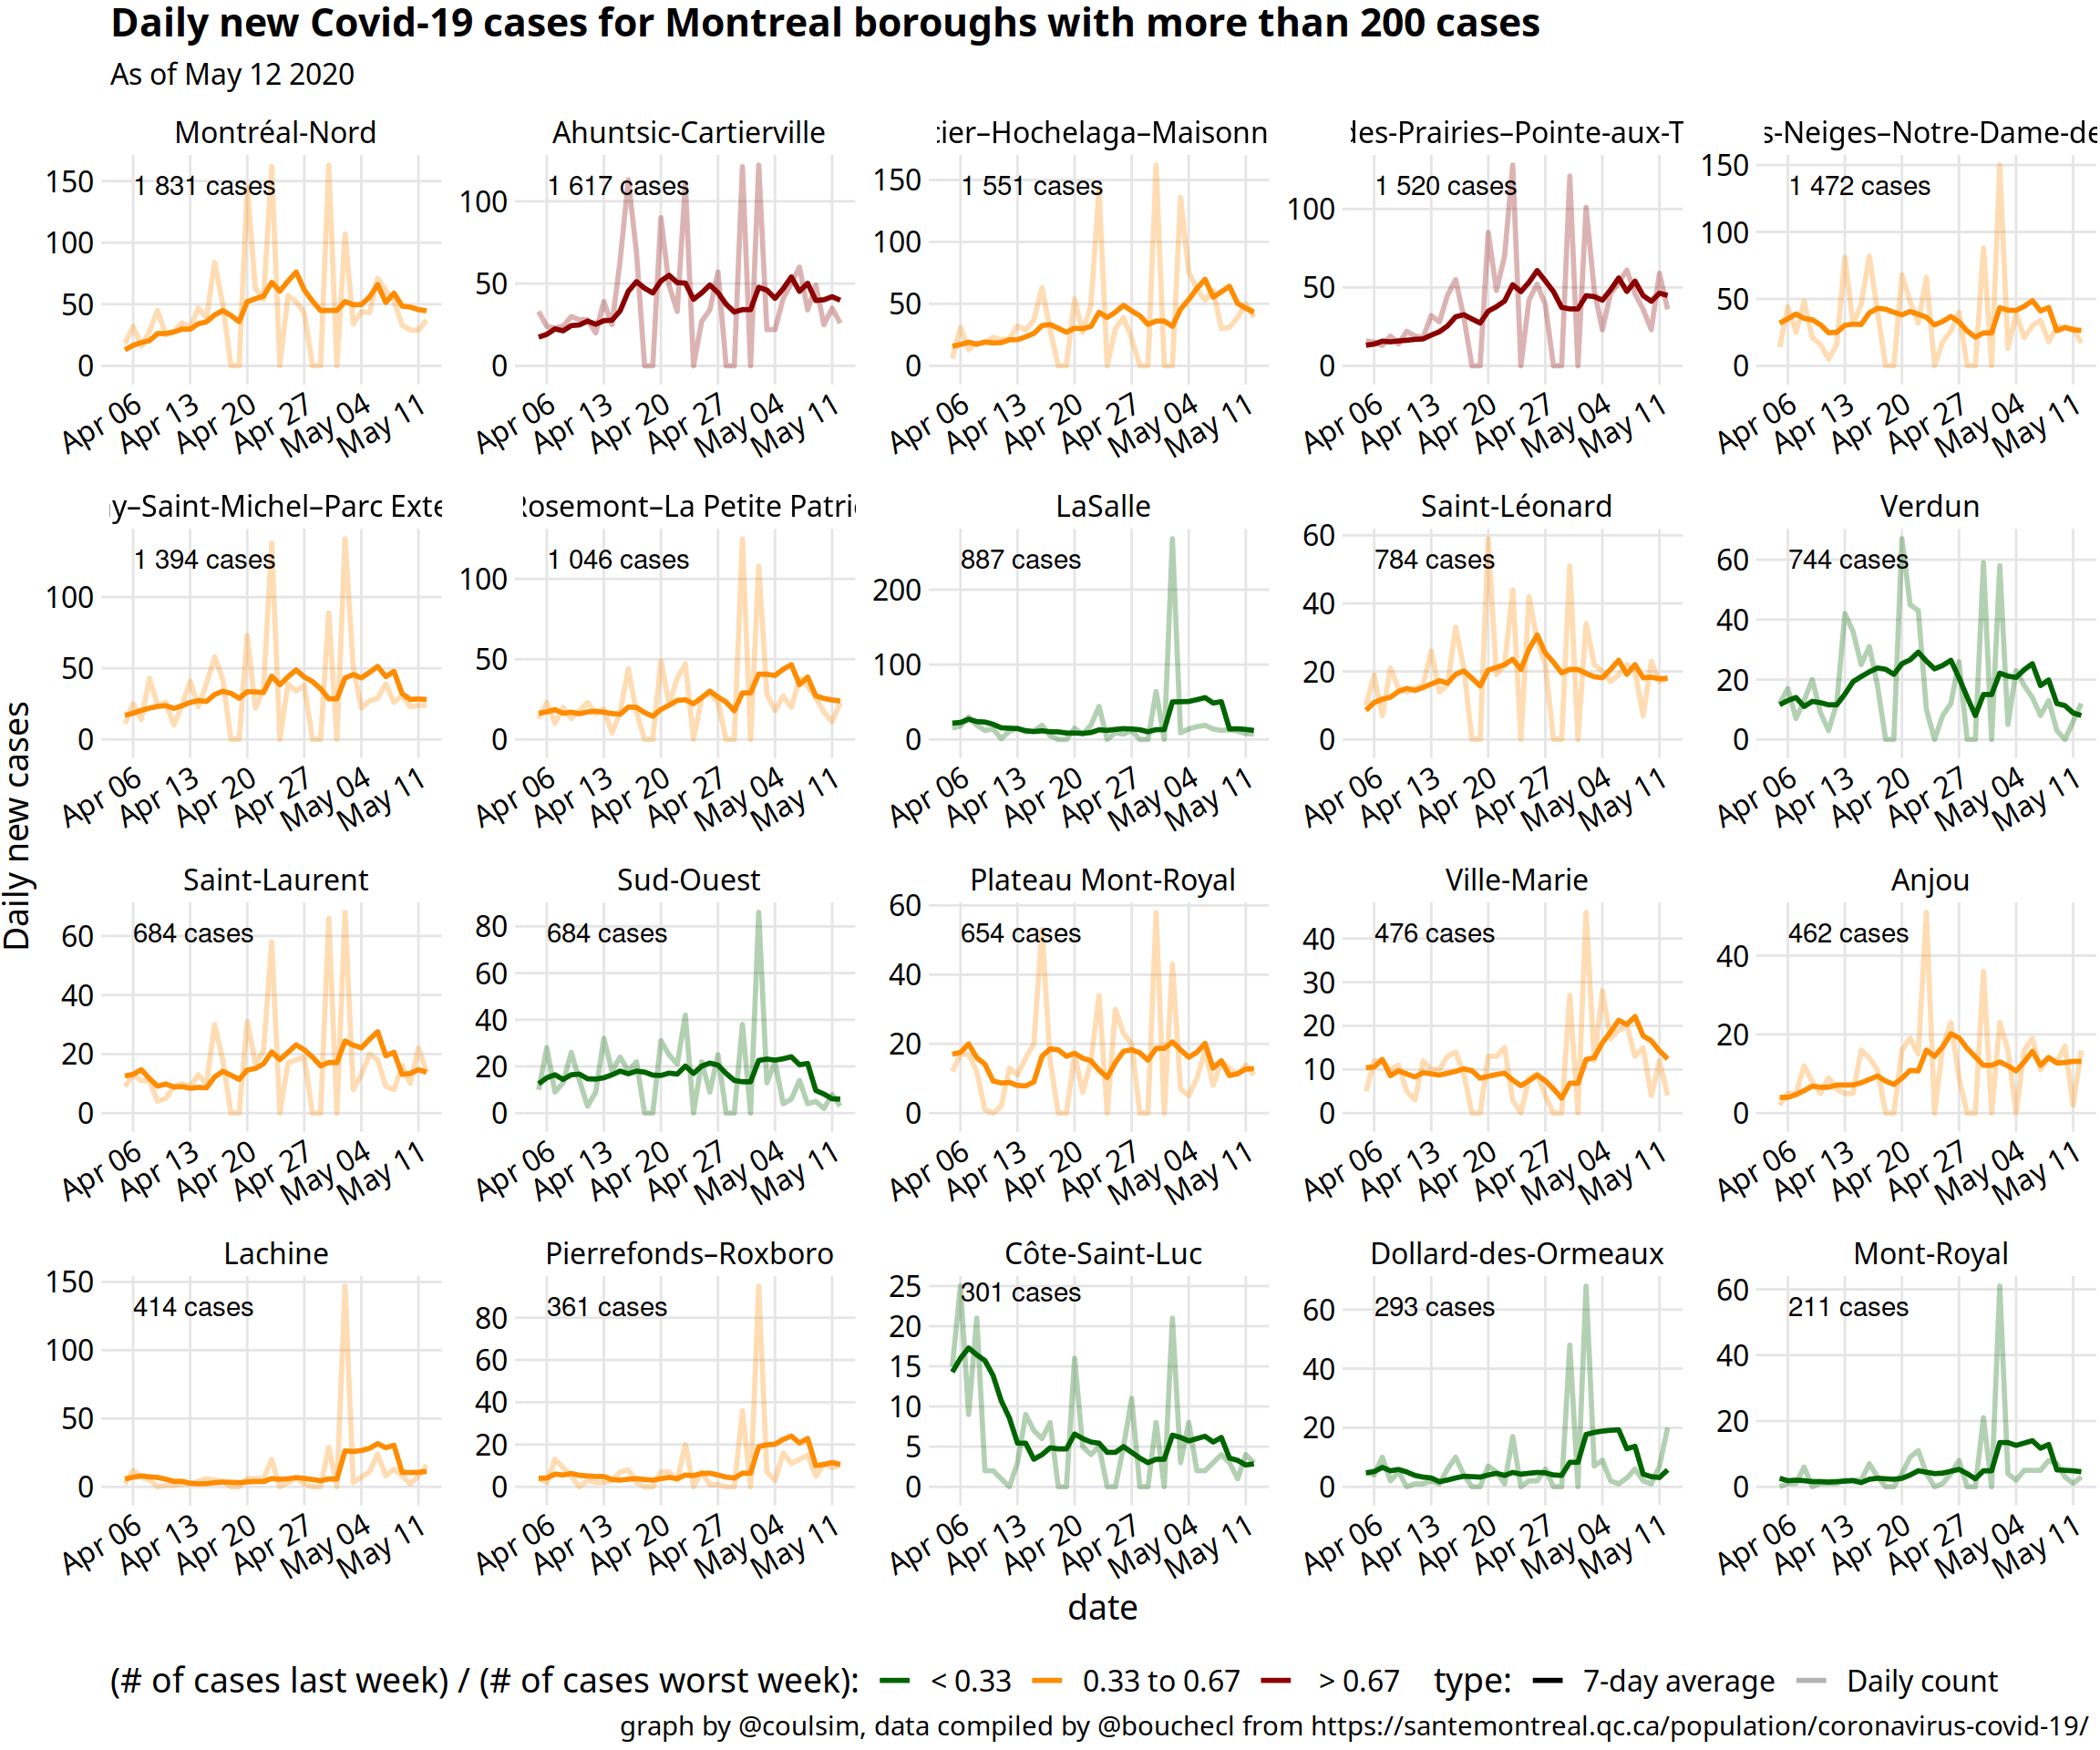
Quick post inspired by the winning / nearly there / need action graphs by @yaneerbaryam at https://www.endcoronavirus.org/countries.
Data Health regions date is compiled by Isha Berry & friends github. Montreal boroughs data is published daily. They only keep the total and keep no history, so @bouchecl visits them every day and compiles the data in this google sheet
Code I went a bit over the top for this one and created an R package you can install to recreate all the graphs and fetch the data.