Quick blog post basé sur les données des véhicules en circulation de la SAAQ 2013-2019 (https://www.donneesquebec.ca/recherche/dataset/vehicules-en-circulation).
Le but c’est de voir quelle marque a le plus de véhicules sur la route après quelques années. Sans surprise les toyota et honda de ce monde dominent largement. Deux curiosités: les F150 disparaissent (exportés?) ainsi que les volkswagen (dieselgate?)
Reasons I’ll come back to this post: {showtext} and font_add_google. Mise en page du dernier graphique (palette, polices) inspirée de https://github.
(code volé à un dude qui a fait la même chose pour les costco à Anchorage, Alaska)
Petit projet avec utilisation de: - osmdata pour trouver les ashton - (new to me) de mapboxapi pour les isochrones - et raster/fasterize pour combiner les multiples isochrones
suppressMessages( suppressWarnings({ library(mapboxapi) library(tidyverse) library(mapdeck) library(osmdata) library(leaflet) library(sf) library(raster) library(rgeos) library(fasterize) library(rgdal) library(sf) library(dplyr) library(purrr) library(mapview) }) ) step 1 : trouver les ashton avec osmdata
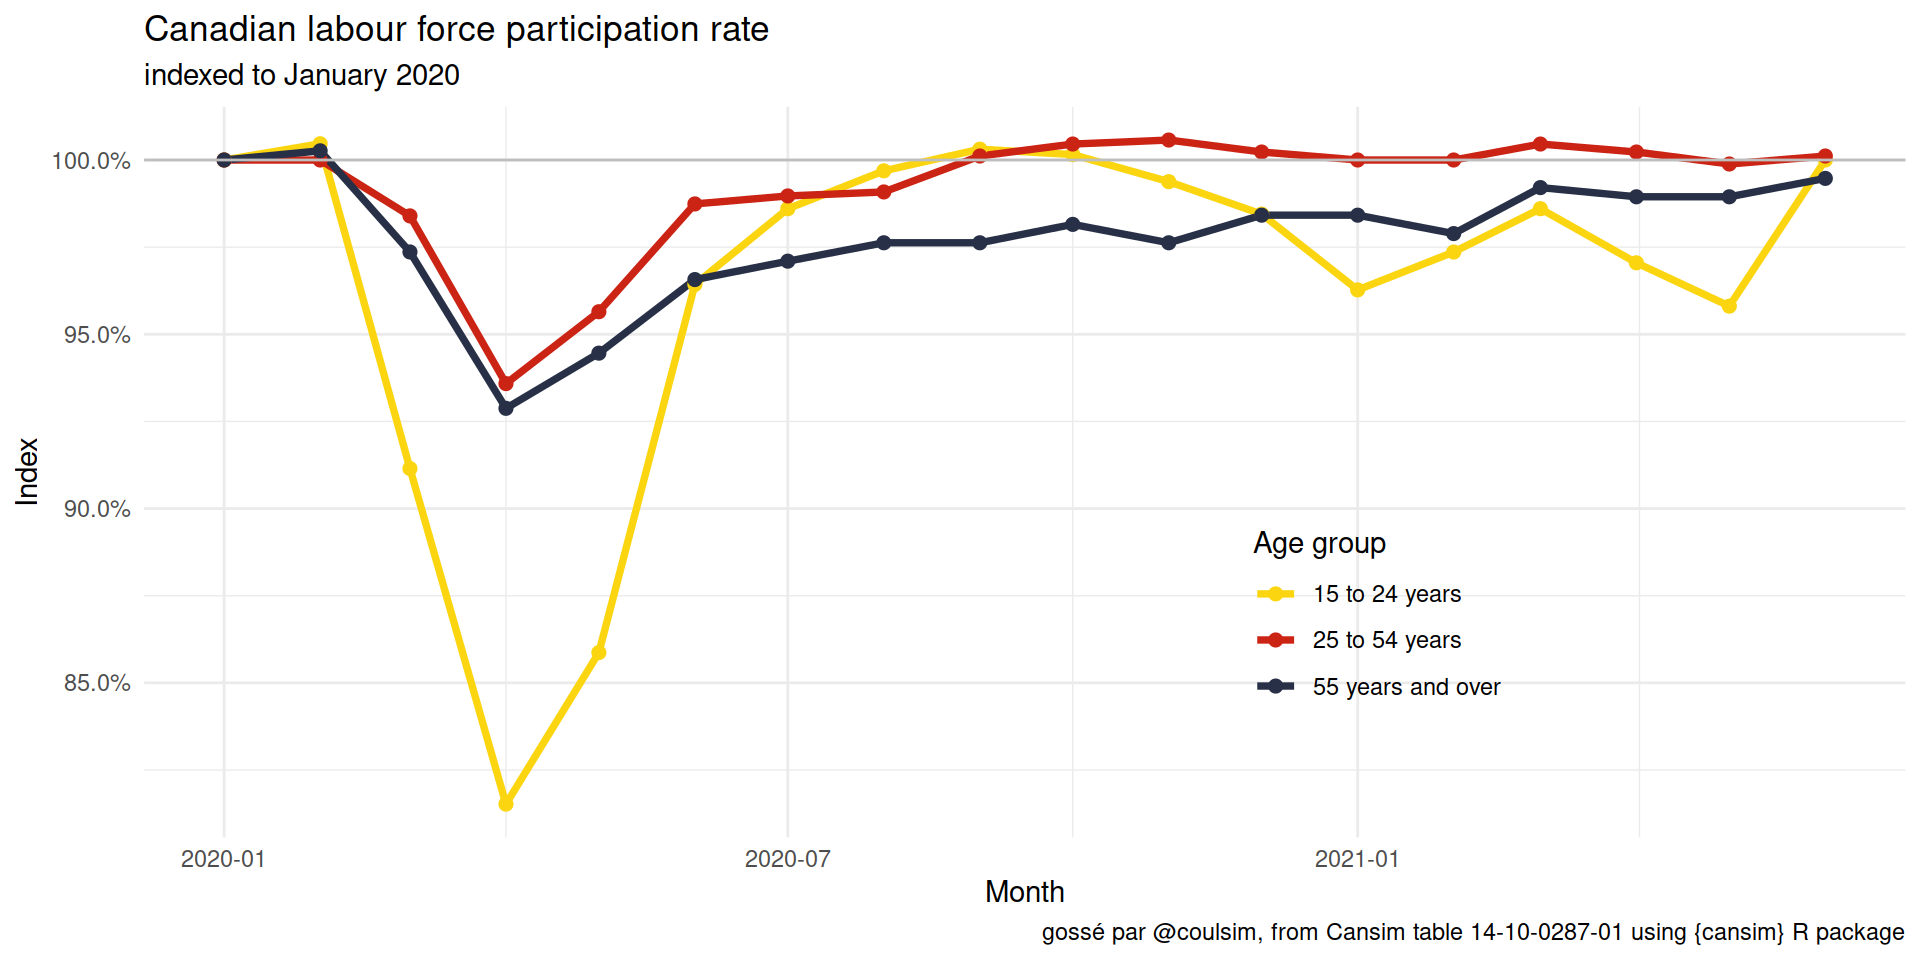
Petit post rapide qui utilise les données de Statistique Canada pour regarder l’évolution du taux de participation pendant et après la pandémie.
blo
Quick post inspired by the winning / nearly there / need action graphs by @yaneerbaryam at https://www.endcoronavirus.org/countries.
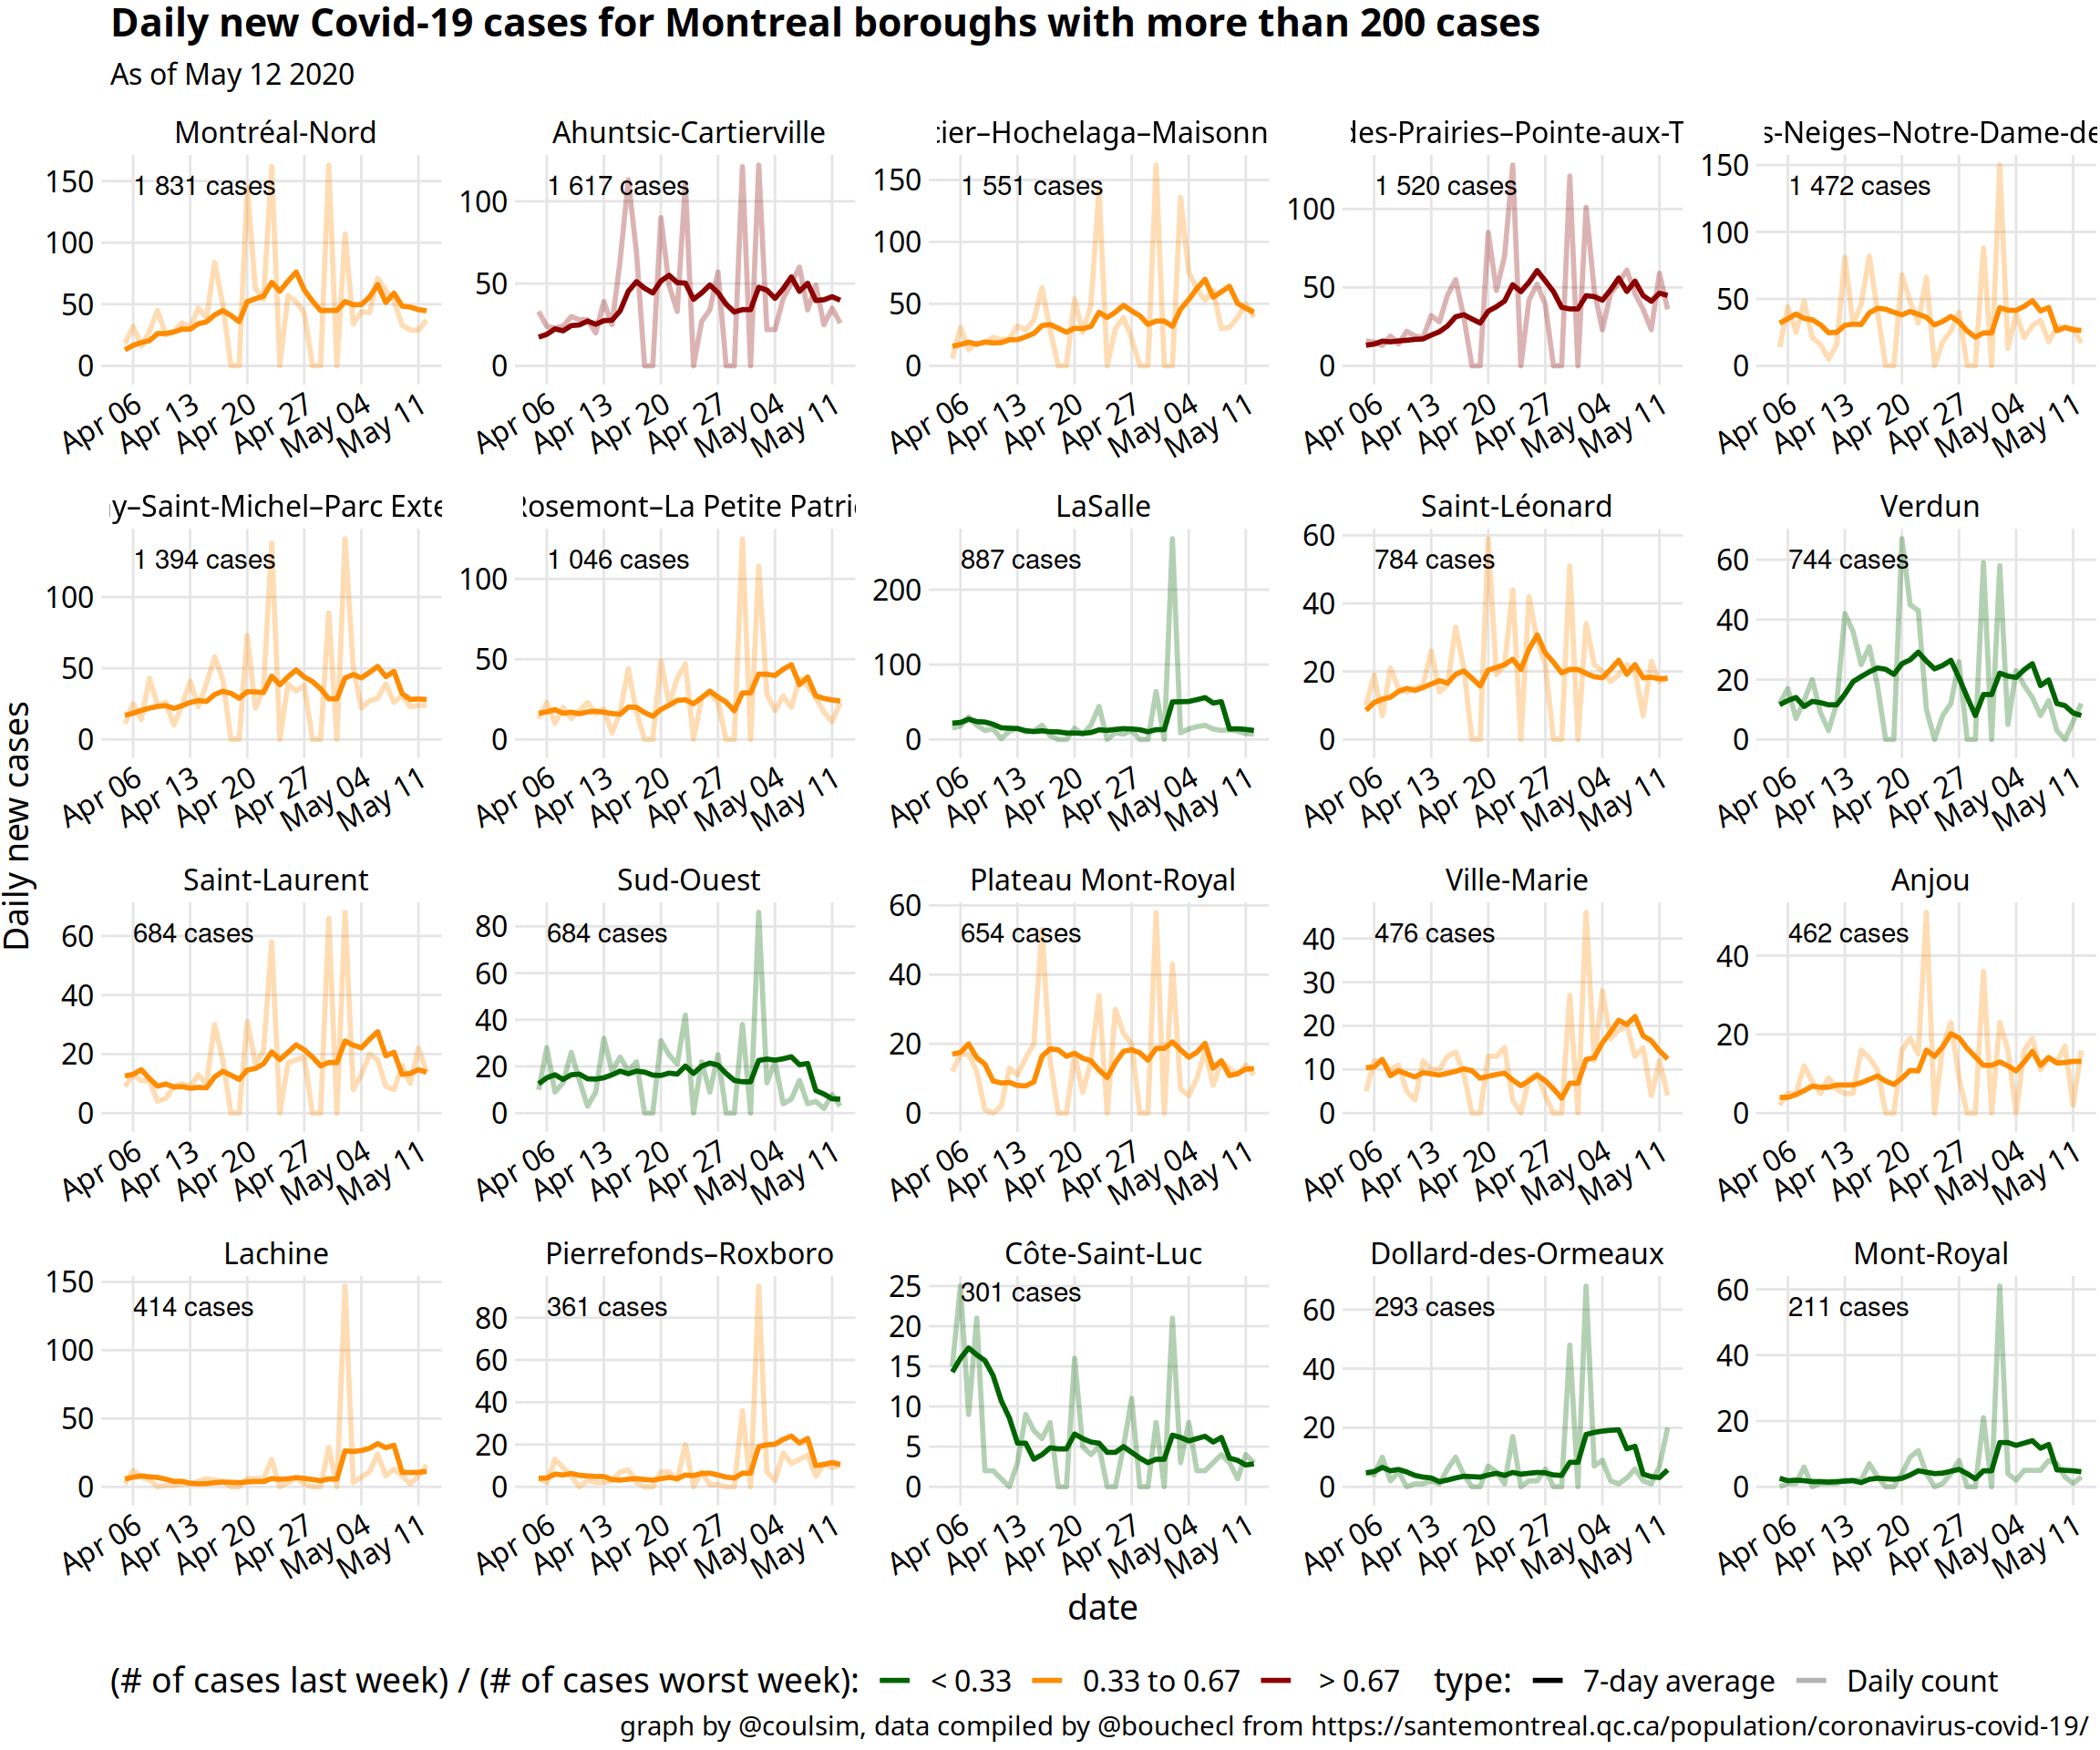
Data Health regions date is compiled by Isha Berry & friends github. Montreal boroughs data is published daily. They only keep the total and keep no history, so @bouchecl visits them every day and compiles the data in this google sheet
Code I went a bit over the top for this one and created an R package you can install to recreate all the graphs and fetch the data.
I made a twitter survey a couple of months before the apocalypse to help me pick my next blog post topic and all 3 members of the crowd overwhelmingly agreed that I should use bike gps data and graphhopper to find out how far cyclists are willing to go to use safer infrastructure.
This is awesome, because I had been looking for a use for this open data that contains GPS data for ~ 5000 bike trips in Montreal for a while.
I’m building my first tweedie model, and I’m finally trying the {recipes} package.
We will try to predict the pure premium of car insurance policy. This can be done directly with a tweedie model, or by multiplying two separates models: a frequency (Poisson) and a severity (Gamma) model. We wil be using “lift charts” and “double lift charts” to evaluate the model performance .
Here’s is the plan:
Pre-process the train and test data using recipes.
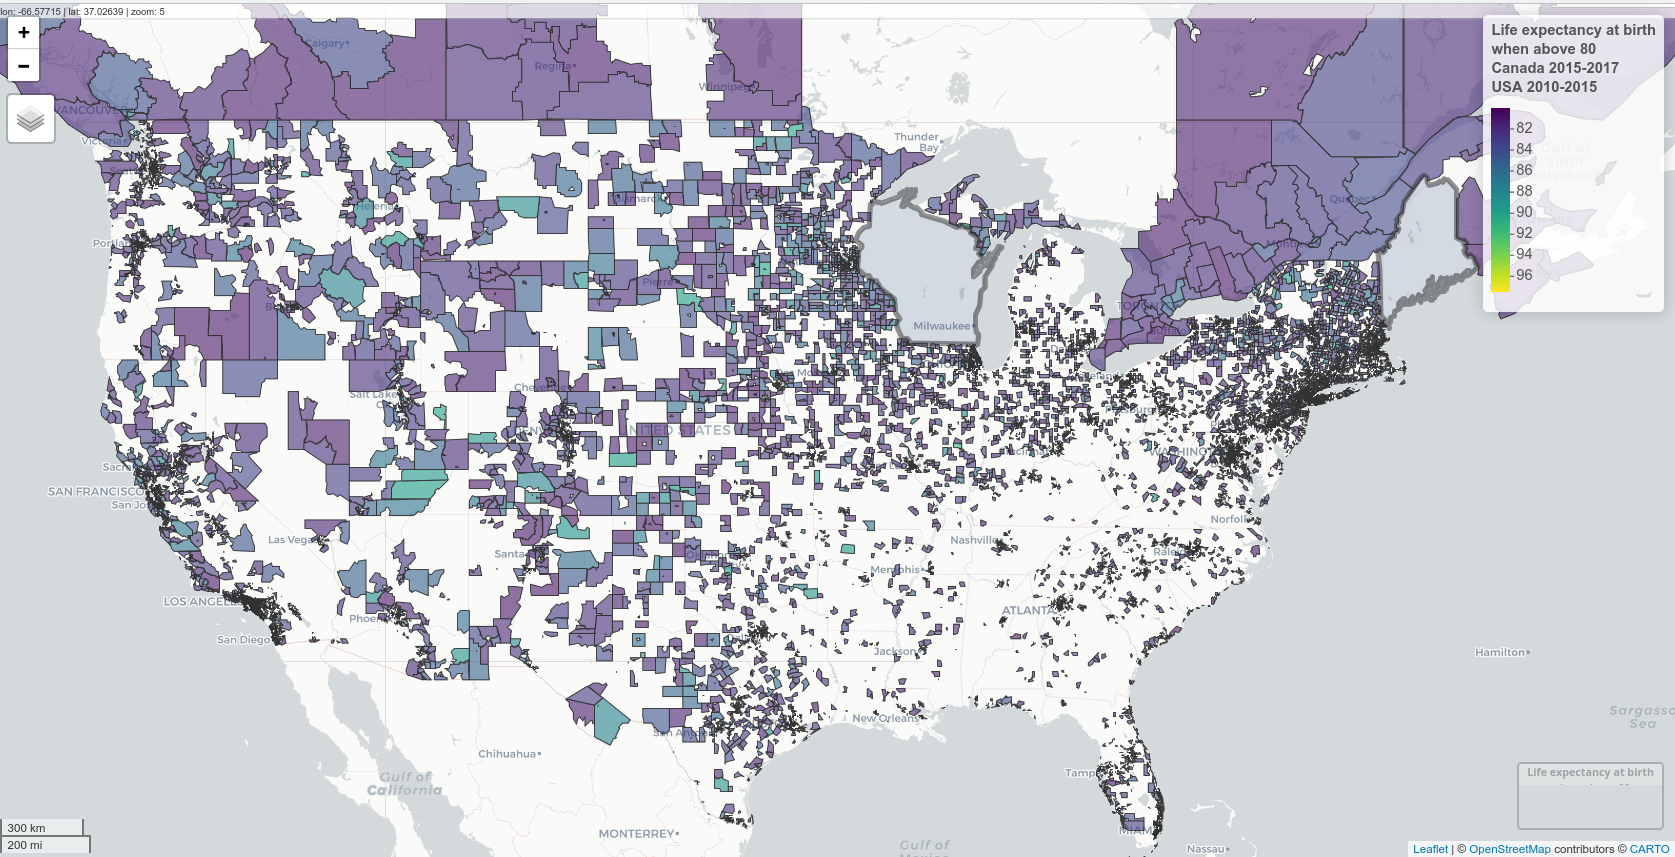
I found life expectancy at birth data for “health regions” in Canada for 2015-2017 and in “census tracts” in the USA for 2010-2015.
Here is a map of these two countries, excluding areas with a life expectancy at birth lower than 0.
Data sources and shapefiles: Canada mortality. Canada shapefiles. USA mortality. USA shapefiles downloaded using the tigris package. Libraries The usual data wrangling libraries for spatial data (tidyverse, sf), mapped using mapview and leaflet.