
Do photo radars reduce crash frequency? (or are they just cash cows?)
I just got a speeding ticket by the mail. I’m pissed off, mostly at myself.
Yet, I now have two questions regarding the relevance and efficiency of photo radars:
- Relevance: Are photo radars optimally located in areas with lots of crashes?
- Efficiency: Do photo radars reduce crash frequency?
Let’s figure this out by look at some #opendata from Montreal.
Disclaimer: I am not a domain expert, I didnt even bother to do a litterature review. I’m just a pissed off dude killing an evening while the kids are asleep.
The data
We combine two sources:
- The crash data for the years 2012-2018 comes from the the city of Montreal’s open data portal.
- The radar location and installation dates come from Données Québec.
The code
As usual, the code is on my github.
The most useful code snippet I will come back here for is the combination of split() and map() to perform rowwise computation on sf objects. I use it to find the crashes that happened within 100 meters of a photo radar:
get_accidents_proches <- function(radar){
distances <- as.numeric(st_distance(radar, accidents))
accidents_proches <- distances<100
if(sum(accidents_proches) > 0){
data <- accidents
data$distance_du_radar <- distances
data[accidents_proches,]
} else{NULL}
}
radars %>%
mutate(accidents_proches = split(., 1:nrow(.)) %>%
map(get_accidents_proches)
) note that you can sometime map geometry directly:
radars %>% mutate(
bb = map(geometry, st_bbox)
)I also like this function from data.table that allows me to bind the rows of sfdata.frames:
sf::st_as_sf(data.table::rbindlist(pouet$accidents_proches))The following code is used to wrap the text in the facet titles :
facet_wrap(~ descriptio, labeller = label_wrap_gen(width = 30))The results
Relevance
Here is a heatmap of the 171 260 crashes that occurred in Montreal between 2012 and 2018. The camera markers show the locations of the 5 fixed photo radars. I believe we can agree that some locations with tons of accidents were ignored.
To assess the relevance of a location choice and the crash-reducing efficiency of the radars, we look at the number of number of crashes within a hundred meters radius of the location. This means that we sometime count accidents that occured on different road than the one the radar is on. I couldnt probably improve this result by drawing “road segments where I think the radar will have an impact”,but this would still be noisy since the radar is only effective in one direction.
Here is a table showing the number of crashes near the location of each photo radar between 2012 and 2018, followed by a map displaying the nearby crashes.
| descriptio | typeAppare | date_debut | n |
|---|---|---|---|
| Boulevard Décarie en direction nord, à l’intersection de la rue Paré | Appareil de surveillance au feu rouge | 2011-11-01 | 302 |
| Rue Sainte-Catherine Est, à l’intersection de la rue D’Iberville | Appareil de surveillance au feu rouge | 2011-11-01 | 97 |
| Rue Berri, à l’intersection du boulevard Henri-Bourassa Est | Radar photo fixe et surveillance au feu rouge | 2015-06-01 | 84 |
| Route 138 en direction est, entre le pont Mercier et l’autoroute 20 | Radar photo fixe | 2015-06-01 | 21 |
| Chemin McDougall en direction est, entre Le Boulevard et l’avenue Cedar | Radar photo fixe | 2011-11-01 | 9 |
The three “red light” radars appear important. The Décarie radar has 302 “nearby crashes”, and the map confirms that most of them happened at the intersection. The same is try for the “Ste-Catherine” red-light radar and the “Berri” red-light radar.
The speed-limit radars (McDougall and Route 138) appear quite pointless, with few nearby crashes (9 and 21) between 2012 and 2018. Worse yet, the map shows these nearby crashes actually happened on parallel roads and couldnt have been influenced by the radars.
The two speed limit radars (Chemin McDougall and Route 138) are cash cows, since absolutely no crash occured on the actual roads between 2012 and 2018.
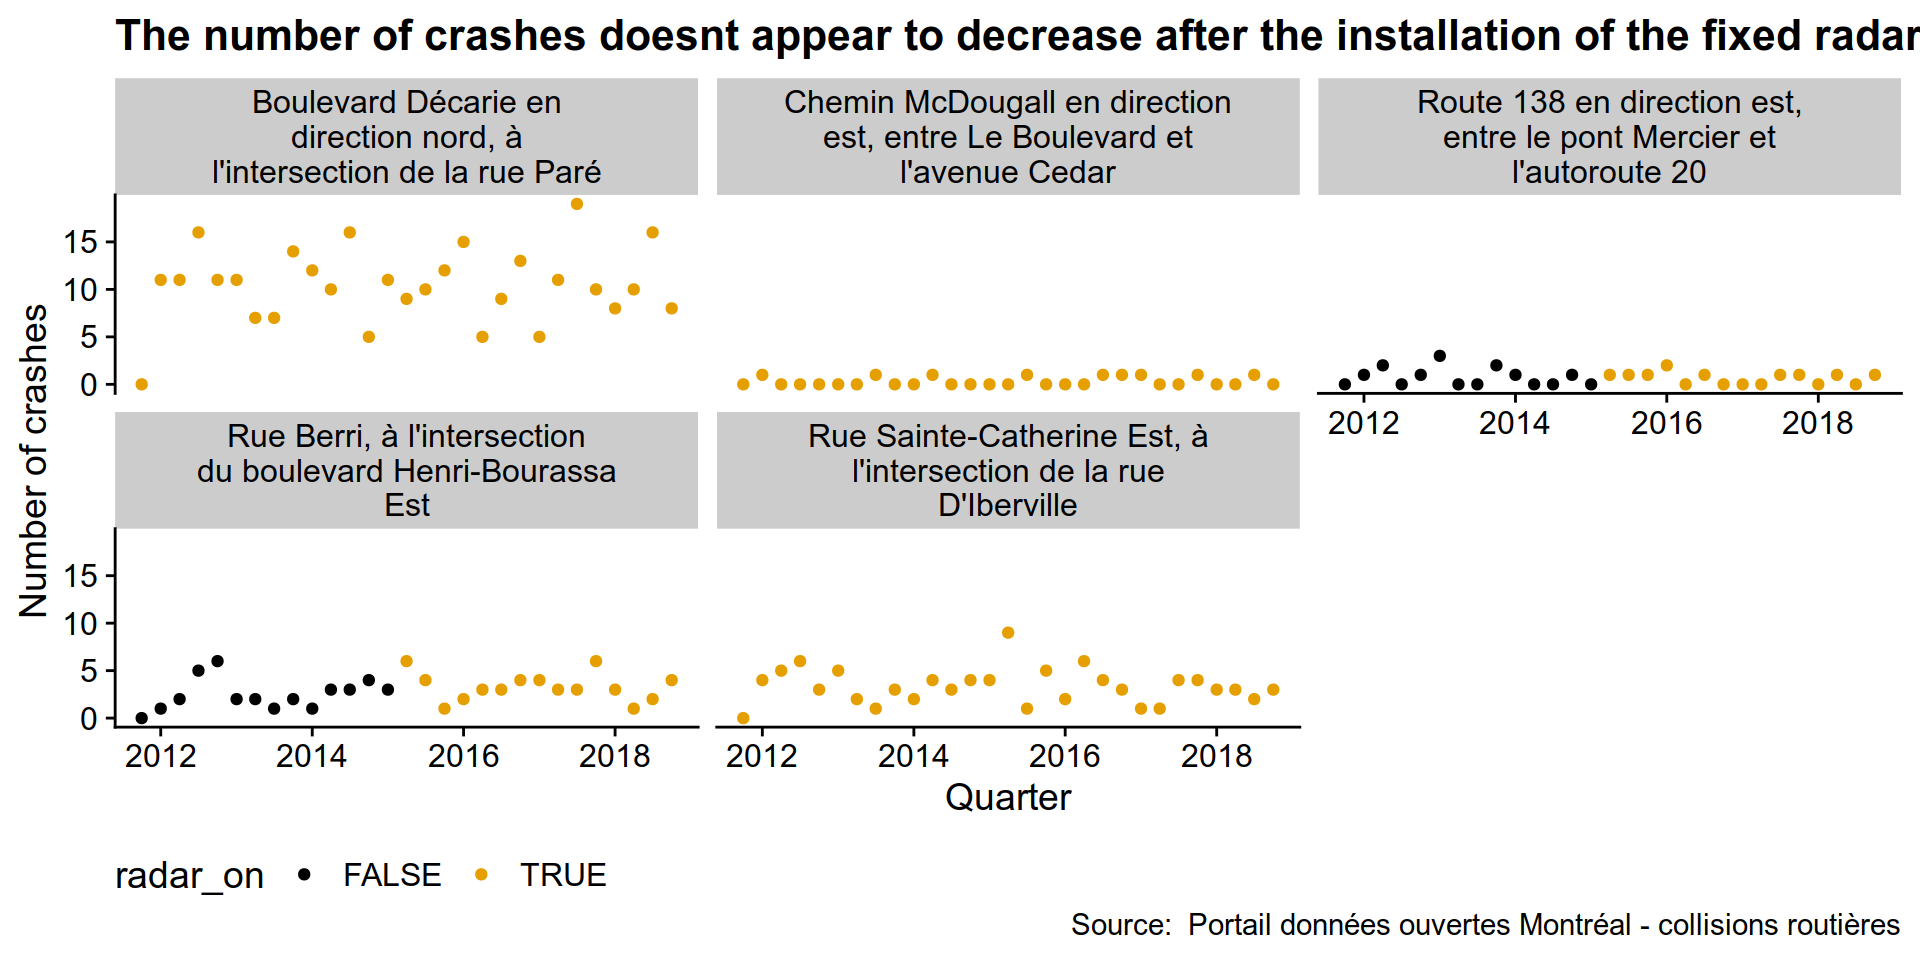
Efficiency
3 of the 5 radars were installed before the beginning of the crash data. We can use use the remaining two radars to evaluate the efficiency of the radars in reducing the frequency of crashes. The graph and the table below show that in both cases the number of crashes didnt go down.
For the Berri red-light radar, the number of crashes within 100 meters of the intersection was 13 in the year before and after the installation of the radar. For the cash-cow Route 138 speed limit radar, the number of nearby crashes increased, but is not relevant since these crashes all happened on parallel roads. The number of nearby crashes on the actual road remained constant at.. 0.
| radar | after | before |
|---|---|---|
| Route 138 en direction est, entre le pont Mercier et l’autoroute 20 | 5 | 1 |
| Rue Berri, à l’intersection du boulevard Henri-Bourassa Est | 13 | 13 |
Conclusion
We don’t have much data, but let’s prematurely jump to the following conclusion:
- Relevance: some of these radars are clearly meant to be used as cash cows because they are located where no crash ever happened 7 years. Locations with frequent crashes abound: the crash database contains 171 260 crashes.
- Efficency: radars do not appear to reduce the number of nearby crashes.
The goal of this post was to waste some time and hopefully launch a discussion. So, what do you think? Any ideas? Please reach out on twitter @coulsim . cheers!